Each subject, regardless of its relevance to your desired career, can teach us something.
English teaches us communication; mathematics shows us how to solve problems, Science explains the world around us and the arts push us to our creative limits. Geography is no exception. Geography gives students a global mindset through not only the study of the world’s environmental and social standings, but it’s potential.
We, at A Team understand that showing your skills in Geography is difficult…but we know it is doable. The study of Geography encompasses English, maths, history, science and more, which makes achieving an A so tricky. Don’t let this deter you. Geography is rewarding, exciting and so relevant to the evolving world around us.
1. Know your History
I can already hear the “Isn’t this how to get an A in Geography?” already. But it’s true, for one to understand the world around them, it’s imperative that one knows where it has been to know where it is going.
If you’re not the biggest fan of Geography, then I highly doubt you’re a History supporter either. However, the correlation and even causation (more on that soon) between the two is uncanny. Geography and History often get placed in the English/Maths or Cat/Dog category, like they are polar opposite subjects to only be studied one semester at a time.
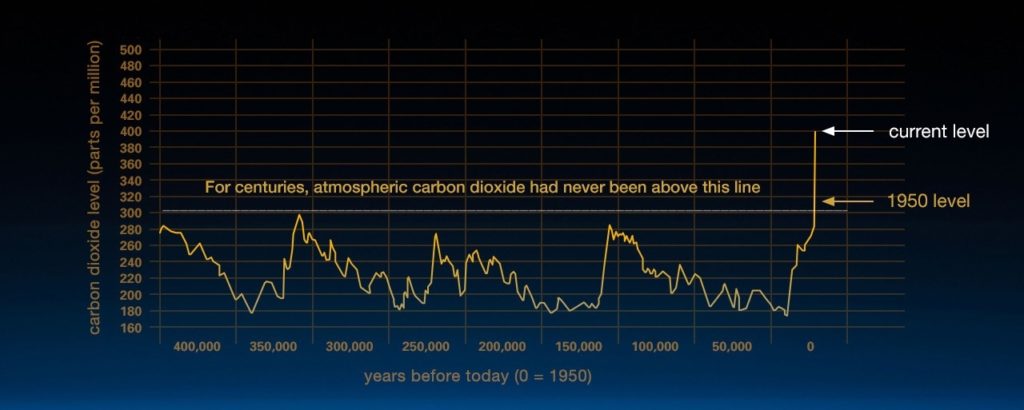
This couldn’t be further from the truth. History dictates the future and fundamentally can shape the Geography around us. Take Climate change, for example, it might be an overused topic but its relevance is undeniable. This graph from NASA tells us that History is shaping our Geography.
You can see that Carbon Dioxide levels are twice as high as they ever have been in the past 68 years. Using this historical information, we can make not only make predictions and assumptions about the Geography of the world now but also the future!
2. Visualise
Speaking of graphs, the second tip is to translate as much data as you can into visual forms.
See what I did there?
Geography is challenging to understand based on numerical data. Once translated into a visual depiction not only does it allow you to understand the data you are working with, it makes communicating your ideas and findings easier and more enjoyable for the reader.
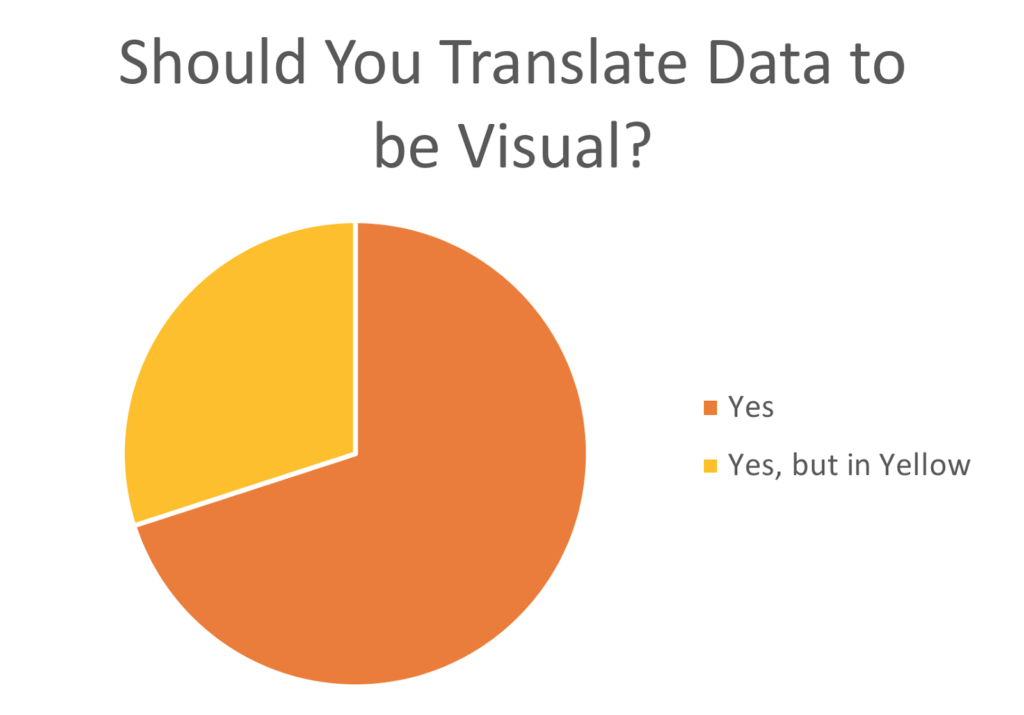
At A Team Tuition, we believe in the three learning languages, the first being Aural (people who learn best by listening – the ‘sponge’ brain type), the second is Kinaesthetic (people who learn best using hands-on work) and finally is Visual learners (those who learn best by creating diagrams and visual representing data). Most people thrive and understand information best using visual stimuli, hence the pie graph above!
The type of data that goes into graphs and visual formats is data that is comparative with itself and other forms of data. Think to compare populations, or looking at trends over time.
The choice made in graph selection is CRUCIAL. I was once under the impression that all graphs are created equal. This is not the case.
For representing data comparing single numbers such as populations, use a column or bar graph. For data that in total represents a whole of something (100%), for example comparing how many people have access to clean water, use a pie graph. For showing a trend over time either growing or shrinking use a line graph.
3. Break It Up
When it comes to the placement of your graph, breaking up your Geography assessment is also of crucial importance. Unlike English where essays or presentations follow a linear pattern, Geography is much more structured and requires much more planning and breaking up of topics in assessment.
If you were to be creating a field report collating data from tide levels at your nearest beach, breaking up going about the assessment is fundamental to an organisation which will, in turn, result in an efficiently crafted report.
With Geography, your plan of attack should always start with research. Consider knowledge like a flashlight and your assessment like a dark tunnel. Without any prior knowledge, once you have commenced writing your assessment, you will quickly find yourself lost and unsure of not what to write, but where to put your data or analysis.
Every one of us at A Team would agree that once research is underway, this is where you can start to break up doing the assessment into manageable chunks. I recommend setting goals with tangible targets such as “complete section 2-B.” rather than “complete 30 minutes of work”. This will not only allow you to plan the assessment more efficiently, but also make you feel a lot more accomplished after your work.
4. Know Your Lingo
Maths has B.O.M.D.A.S., while English has P.E.E.L. Geography has many terms and jargon that students striving for an A should know. Most of these that are pertinent to your topic will be found in glossaries, which are the definition section at the back of most textbooks.
Some of our favourites at A Team are:
- B.O.L.T.S.S. – when creating a map make sure to include ‘B.O.L.T.S.S.’, as listed below:
- Border
- Orientation
- Legend
- Title
- Scale
- Source
- Biomes – a large naturally occurring group of flora and fauna
- Forest
- Desert (not to be confused with dessert, although tasty they are two very different things)
- Ocean
- Socio-Economic – the relationship between a group of people and their economic status
- Biodiversity – having a broad ecosystem that is self-sufficient and broad with many flora (plants) and fauna (animals)
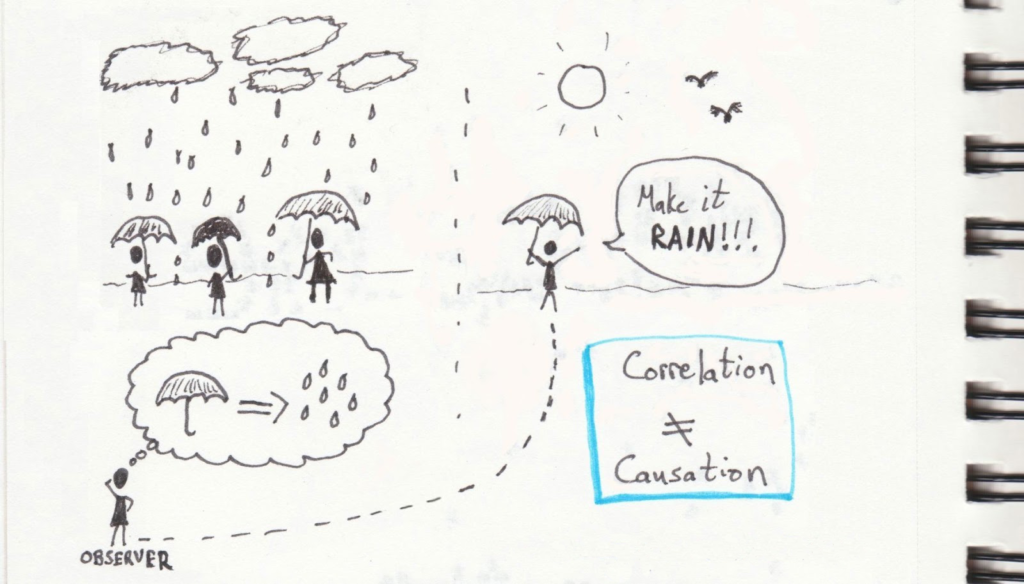
5. Correlation ≠ Causation
Often used throughout Geography papers worldwide this data analysis error is easy to make and hard to cover up. When analysing data and similarities are found, there is either a correlation or causation.
Correlation is the idea that two sets of data follow a similar pattern yet do not influence each other. Causation is the idea that one set of data will influence another. Take a look at this data set below; it shows the Divorce rate in Maine and levels of margarine consumption.
Although the data is near identical, it would be preposterous to assume that higher consumption of margarine = a higher divorce rate. This is a prime example of correlation. Causation, however, is where one data set influences another.
For example, rising heat levels may cause rising sales of ice cream, and the more you study with an academic personal trainer at A Team, your grades can increase! It is necessary to note the difference when faced with it, but that shouldn’t stop us from laughing at a few examples.
6. Understand the Importance of the Topic
When studying Geography, every topic has its purpose. Geography is relevant and pertinent to every person on Earth. Pollution, extinction, famine and illness are all topics you will come across in your geographical endeavours. On paper, these issues can be dry. However, they are some of the most critical issues in the modern world.
Take Climate Change for example. The United Nations have just released a report outlining the dangers and imminent threat of climate change such as temperatures rising 1.5° after 2030.
The relevance of the topic is why most assessment will ask for predictions or recommendations (known as interpretation and analysis), to put the issue into a worldly context. Of course, the importance of each topic is subjective.
7. Diverse Sources Are Key
Finally, it is recommended to have as much diversity in your sources as possible. It may seem that your teacher is looking for as many sources as you can cram into your research book. What your teacher is looking for is a diverse range of sources. Using 3 to 4 compared to 1 to 2 references to prove a point makes for a stronger argument.
As much as we all wish every source were equal in academic reliability, this isn’t the case.
Repeat after me:
Not all information is made equal in reliability!
Wikipedia is a solid starting point to gain a rough understanding of the topic. However, that’s where your relationship with the free encyclopedia should end. Using both information available on the internet and information in books you will have a dynamic and diverse range of sources which is key to an academically strong assessment.
We at Team Tuition believe that Geography studies is all about proving yourself right. Using your sources, understanding the relevance of the topic and its specific data you should have no problem capturing that A.
Good luck!
The post How To Get An A In Geography – 7 Steps appeared first on A Team Tuition.
from A Team Tuition https://ift.tt/2TBRRTh
via IFTTT


No comments:
Post a Comment